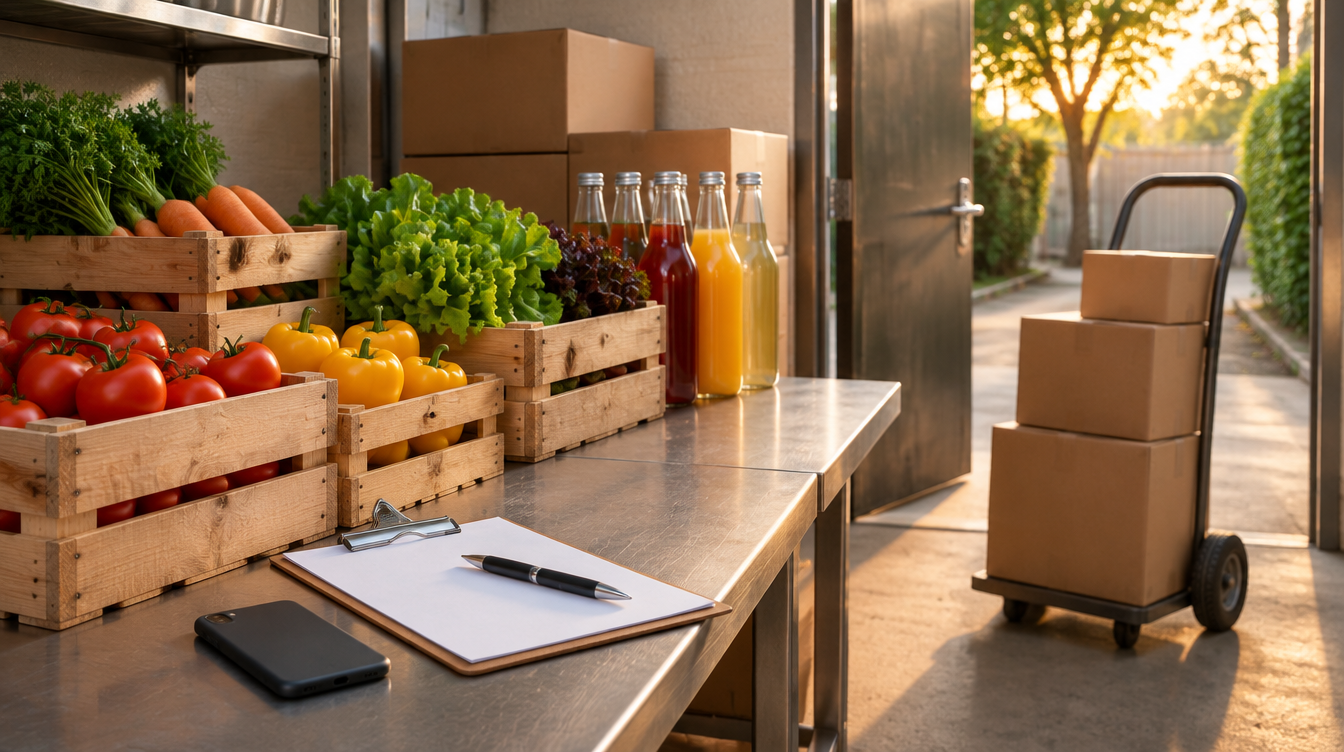
An order with your drinks supplier every week, every week checking the delivery note, putting stock away and matching the invoice. Or one big delivery per quarter that ties up cash and storage space for weeks. Both cost money, just in different places. The optimal order quantity is exactly the point in between: the quantity at which the sum of ordering costs and holding costs is lowest.
In this article you will learn which costs sit behind an order in hospitality, how the Andler formula works and how to calculate the optimal order quantity with two examples from the bar and the kitchen. You will also see where the formula reaches its limits and how to combine it with minimum stock, shelf life and pack sizes into an ordering routine that works in day-to-day operations.
1. What is the optimal order quantity?
The optimal order quantity is the amount of an item you should order each time so that your total ordering and holding costs over the year are as low as possible. It does not answer the question of when you order, but how much.
The "when" is handled by the reorder point: as soon as stock falls below a certain level, you trigger an order. How to set that level is explained in our article on calculating minimum stock. The optimal order quantity completes this logic: it tells you how large the reorder should be.
Behind the idea is a simple trade-off. As the Lexware business glossary (German) sums it up, large order quantities lower ordering costs but raise holding costs. Small quantities do the opposite. The optimal order quantity lies where both effects balance out.
2. Ordering costs and holding costs: the two opposing forces
Before you calculate anything, you need to know which costs actually arise in your business. In hospitality these are rarely invoice items; they are mostly working time and tied-up cash.
Ordering costs (fixed per order)
Ordering costs arise with every order, regardless of whether you order 6 or 60 bottles. Typical examples:
- Time to place the order: checking stock, writing the order list, ordering from the supplier.
- Goods receipt: accepting the delivery, checking quantities and quality, putting stock away. Our guide to goods receipt inspection shows how to do this in a structured way.
- Paperwork: recording the delivery note, checking and filing the invoice.
- Delivery costs: delivery fees or small-order surcharges, if your supplier charges them.
Important: you usually order many items in one delivery. The ordering costs are then spread across all line items. For the calculation per item, you only use the proportional amount.
Holding costs (rise with the quantity)
Holding costs grow with every bottle and every kilo sitting in storage. They include:
- Tied-up capital: money that is tied up in stock is not available for staff, rent or investments.
- Storage space and refrigeration: cold room, cellar and shelving cost floor space and energy.
- Spoilage, breakage and shrinkage: the longer goods sit, the higher the risk that they expire, get damaged or disappear.
For the calculation, you combine holding costs into a holding cost rate: a percentage of the stock value per year. A rate of 20% means that every euro sitting in storage for a year costs you 20 cents. You set this rate for your own business as an estimate based on capital costs, storage space and your typical loss rate.
3. The Andler formula for the optimal order quantity
The best-known method to calculate the optimal order quantity is the Andler formula. According to Wikipedia (German), the underlying model goes back to Ford W. Harris, who published the first lot-size formula in 1913. In German-speaking countries it is named after Kurt Andler. It reads:
Optimal order quantity = √( 2 × annual demand × ordering cost per order ÷ (unit cost × holding cost rate) )
The building blocks:
- Annual demand: how many units (bottles, kilos, litres) you use per year.
- Ordering cost per order: the fixed cost of one order, proportionally for this item.
- Unit cost: the net purchase price per unit including delivery costs.
- Holding cost rate: as a decimal, so 0.20 for 20%.
Sometimes the formula uses the number 200 instead of 2. It is the same calculation, except that the holding cost rate is entered as a percentage (20 instead of 0.20). Both versions give the same result.
The logic behind it: at the optimal quantity, the annual ordering costs are exactly as high as the annual holding costs. Holding costs are calculated on the average stock level, i.e. half the order quantity, because stock falls from the full quantity to zero between two deliveries.
4. Calculating the optimal order quantity: an example from the bar
Take a cocktail bar that uses 6 bottles of London Dry gin (0.7 l) every week. The values for the calculation:
- Annual demand: 6 bottles × 52 weeks = 312 bottles
- Proportional ordering cost for the gin per order: 5.00 €
- Unit cost: 18.00 € net per bottle
- Holding cost rate: 20% per year
Plugged into the Andler formula: √(2 × 312 × 5.00 ÷ (18.00 × 0.20)) = √(3,120 ÷ 3.60) = √866.7 ≈ 29.4 bottles. Rounded to full cases of 6 bottles, that gives 30 bottles per order, i.e. about ten orders a year or roughly every five weeks.
It gets interesting when you compare the options. This is how the annual costs develop depending on the order quantity:
- Weekly, 6 bottles: 52 orders × 5.00 € = 260.00 € ordering costs, plus 3 bottles average stock × 18.00 € × 20% = 10.80 € holding costs. Total: 270.80 €
- Every two weeks, 12 bottles: 130.00 € + 21.60 € = 151.60 €
- Every four weeks, 24 bottles: 65.00 € + 43.20 € = 108.20 €
- Optimal, 30 bottles: 10.4 orders × 5.00 € = 52.00 € + 15 bottles average stock × 18.00 € × 20% = 54.00 €. Total: 106.00 €
- Quarterly, 78 bottles: 20.00 € + 140.40 € = 160.40 €
Two things stand out. First: in this example, weekly ordering is the most expensive option at 270.80 €, a good 165 € more than the optimal quantity. Second: around the optimum, the cost curve is flat. Whether you order 24 or 30 bottles makes a difference of only about 2 € a year. So you do not need to hit the formula to the exact bottle. It is enough to get into the right range and then round to sensible pack sizes.
One item alone will not make a business rich. But if you apply the same logic to your 50 best-selling items, the effects add up. And you quickly see which products you order too often and which you order too much of at once.
5. An example from the kitchen: when shelf life wins
Now the same for perishables. A restaurant kitchen uses 20 litres of cream per week, i.e. 1,040 litres a year. Unit cost 2.40 € per litre, proportional ordering cost 5.00 €, holding cost rate 20%.
The Andler formula gives: √(2 × 1,040 × 5.00 ÷ (2.40 × 0.20)) = √(10,400 ÷ 0.48) ≈ 147 litres. That would be the consumption of a good seven weeks. But if the delivered cream only has 14 days of shelf life left, over 100 litres of it would expire before you could use it.
This is where the formula's biggest weakness shows: it knows nothing about best-before dates. According to Wikipedia, perishable goods are explicitly a case in which the model cannot be applied sensibly. Lexware also points out that products with a limited shelf life are not suitable for large order quantities.
For perishables, therefore: shelf life sets the upper limit. Order at most as much as you will reliably use before it expires, and plan two smaller deliveries a week rather than one big one. To make sure older stock is used first, the FIFO principle helps in the cold room.
6. Limits of the Andler formula in hospitality
The formula is based on a number of assumptions that Wikipedia lists as premises, including known and constant demand, instant delivery, no stock-outs, unlimited storage capacity and a constant unit price without quantity discounts. Even Harris warned against using the formula as the sole basis for decisions. For hospitality, this means in practice:
- Fluctuating demand: terrace season, Christmas parties, banquets and events change consumption significantly. So calculate with the consumption of the season, not with an annual average.
- Quantity discounts and promotions: if your supplier gives a discount from 10 cases, a larger quantity can be cheaper. Then compare the saving with the additional holding costs.
- Minimum order values: if your supplier only delivers free of charge above a certain order value, that is another reason to bundle items into one joint order.
- Limited storage space: the cold room does not have unlimited capacity. If the calculated quantity does not fit, it is not optimal.
- Pack sizes: orders come in cases, crates and kegs. Always round the result to a whole pack.
- Safety stock: the basic model has no buffer. In practice you still need one so that no bestseller runs out on a Saturday night.
So the formula is not an autopilot but a compass. It shows you whether you generally order too often or too rarely. You fine-tune with your knowledge of shelf life, season and suppliers. How reliably your suppliers actually deliver is shown by a systematic supplier evaluation.
7. Order quantity in practice: your routine in four steps
This is how theory turns into an ordering routine that you set up once for your most important items and review regularly:
Step 1: Determine usage. The most important figure is your actual usage per item. You calculate it from two stocktakes and the deliveries in between: opening stock + goods received − closing stock = usage. Extrapolated to a year or a season, this gives the demand for the formula. Gut-feeling estimates quickly lead to the wrong quantities here.
Step 2: Set costs. Decide once what an order costs you (working time, goods receipt, paperwork, delivery costs) and spread this amount across the typical line items of a delivery. Add your holding cost rate. Take the unit cost from the latest delivery note or invoice so that it is current.
Step 3: Calculate the quantity. Plug the values into the Andler formula and round to full cases, crates or kegs. Divide the annual demand by the quantity, and you also know roughly how often you will order.
Step 4: Check the limits. Does the quantity fit in storage? Will it be used before it expires? Is your reorder point set so that the new delivery arrives in time? Only when all three questions are answered with yes is the quantity truly optimal.
A good control figure is the inventory turnover rate. When you adjust your order quantities, it changes for the items concerned: it rises where you used to order too much at once and falls where you used to order small quantities too often. Keep an eye on it so that your stock levels stay within the range you want.
8. The data foundation for your order quantities with BarBrain
The Andler formula is only as good as the figures you feed into it. This is exactly where many businesses struggle: usage is estimated, purchase prices come from an old list, and stock is spread across several sheets of paper. BarBrain gives you the data foundation to plan cost of goods and orders properly.
- Stock per area: with the digital stocktake you count via app, including opened bottles. You set up areas such as bar, cellar or cold room once, and several staff members count in parallel. You see the results, including stock value, directly in the app and in the dashboard.
- Goods receipt by photo: with the AI delivery note and invoice scanner you photograph the delivery note, and the AI recognises items, quantities, pack sizes and purchase prices. The goods receipt is booked with one click and stock is updated immediately.
- Current purchase prices: new prices from the scan are applied to your items and recipe costing. That way you always calculate with the real unit cost in the formula.
- Actual usage: opening stock, goods received and closing stock give you the actual usage per item. With the POS integration, you can also compare it with the target usage from your sales and recipes.
- Product catalogue: more than 30,000 products are stored centrally with pack size and volume. That saves typing when you set up your items.
In the example above, the gin delivery with the calculated 30 bottles enters the system by photo. Because every goods receipt is booked straight into stock, the usage you need for the next calculation is correct. For groups and hotels: each outlet is its own account with its own areas. Via the admin overview you compare outlets, for example on cost of goods percentage and shrinkage.
This is what the difference looks like day to day:
In short: instead of estimated usage and old prices, you calculate with the figures from your stocktake and goods receipt, and your stock is updated immediately with every goods receipt. More than 1,000 businesses in Germany, Austria and Switzerland already work with BarBrain. If you want to see what that looks like in your business: Book a demo.
9. Frequently asked questions
How do I calculate the optimal order quantity?
Why do some formulas use 200 instead of 2?
Does the optimal order quantity also apply to perishables?
What is the difference between optimal order quantity and minimum stock?
Where do I get the annual demand for the formula?
About the author
Leia Kuhlbarsch
BarBrain Team