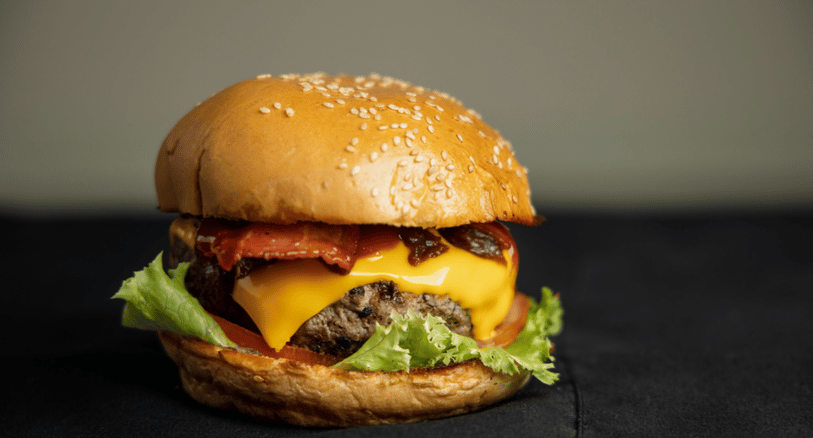
A dish costs €4.20 to prepare and is on the menu at €16.90. Is that enough? The answer doesn’t depend on gut feeling but on a calculation that cleanly separates cost of goods, overheads and target margin. This guide shows you the three types of costing, the complete costing scheme for food and drinks, the factors per product group and the mistakes that quietly eat into the margin in most venues.
1. What costing means in hospitality
Costing in hospitality is the systematic calculation of a selling price that covers cost of goods, the proportional operating costs and a defined profit. It answers two questions: what must a dish cost at minimum to pay its way — and what may it cost at most so that guests still order it.
The difference from pure price setting lies in the direction. Price setting asks what the market will bear. Costing asks what the venue needs. A viable menu price only emerges where both answers overlap.
Costing is not a one-off task. As soon as purchase prices, portion sizes or the VAT rate change, every costing from yesterday becomes an estimate.
2. What are the three types of costing?
Business economics knows three directions of calculation. In practice you need all three — depending on which figure is fixed and which you are looking for.
Forward costing
You know your costs and are looking for the price. From cost of goods via overheads and profit markup to the gross selling price. This is the standard case for new dishes and the calculation that section 3 goes through in detail.
Backward costing
You know the price and are looking for the permissible costs. The market will bear €14.90 for a starter — so how much may the portion cost to prepare? This direction is decisive when your price level is effectively set by competition or location. It gives you the upper limit for cost of goods, which recipe and portioning must be aligned with.
Margin costing
Costs and price are both fixed; what you are looking for is the margin. The typical use case is recalculation: a dish has been running for months, purchase prices have risen — what is left today? Margin costing is the tool for regularly reviewing existing items, not for creating new ones.
3. The costing scheme step by step
Food and drinks follow the same basic scheme but differ in the markups and in how losses are treated. The following table compares both routes line by line.
| Calculation step | Food | Drink |
|---|---|---|
| 1. Net ingredient cost | All components in the exact portion quantity, including sides, sauces, garnish | Pour size at net purchase price, garnish and ice separately |
| 2. Loss surcharge | Add preparation and cooking loss to the raw ingredient (trim loss for vegetables, frying loss for meat) | Pouring loss, breakage, tasting — the largest single item for draught beer |
| 3. = Cost of goods | The base figure for costing | The base figure for costing |
| 4. + Overhead surcharge | Staff, rent, energy, administration — allocated proportionally to the item | Same logic, usually a lower staff share per unit sold |
| 5. = Total cost | What the item really costs the venue | What the item really costs the venue |
| 6. + Profit markup | The venue’s target return, not a residual | The venue’s target return, not a residual |
| 7. = Net selling price | The amount that reaches the venue | The amount that reaches the venue |
| 8. + VAT | Rate depends on the use case — a pass-through item, not income | Rate depends on the use case — a pass-through item, not income |
| 9. = Gross selling price | The price on the menu, then rounded to a price point | The price on the menu, then rounded to a price point |
Two points are regularly skipped in practice. First, the loss surcharge in step 2: if you calculate with the purchased weight instead of the usable weight, you systematically cost too low. Second, the profit markup in step 6 — it belongs in the calculation and is not whatever happens to be left at the end of the month.
Which losses actually occur with drinks and how you measure them is covered in the article on calculating pouring loss.
4. Costing factor and markup: the shortcut
The complete scheme is the clean route. For day-to-day work you need a quicker figure: the costing factor. It is derived directly from the target cost-of-goods ratio.
Costing factor = 100 ÷ target cost-of-goods ratio in %
Example: with a target ratio of 30%, the factor is 3.33. Ingredient costs of €4.20 thus lead to a net selling price of €14.00.
The markup describes the same thing as a percentage: it states by what percentage cost of goods is increased. A factor of 3.33 corresponds to a markup of 233%.
| Product group | Target cost-of-goods ratio | Costing factor | Markup |
|---|---|---|---|
| Spirits (4 cl standard) | 12–18% | 8.3 – 5.6 | 730 – 456% |
| Signature cocktails | 15–22% | 6.7 – 4.5 | 567 – 355% |
| Soft drinks | 15–20% | 6.7 – 5.0 | 567 – 400% |
| Draught beer | 20–25% | 5.0 – 4.0 | 400 – 300% |
| Wine by the glass | 22–30% | 4.5 – 3.3 | 355 – 233% |
| Food, casual dining | 28–32% | 3.6 – 3.1 | 257 – 213% |
| Wine by the bottle | 28–38% | 3.6 – 2.6 | 257 – 163% |
| Food, fine dining | 30–35% | 3.3 – 2.9 | 233 – 186% |
The factors are a guide, not a law. They result from the cost-of-goods target ranges derived in the article on calculating cost of goods. If you ignore location, concept and staff cost structure and simply multiply by 3.33, you produce prices that either don’t hold up or don’t sell.
5. Two worked examples
Food example: salmon fillet with vegetables
Buying 180 g of salmon at €24.00/kg comes to €4.32. Trimming and cooking loss is around 15%, so the costing figure rises to €5.08. Vegetables, side and sauce add €1.40, fat, spices and garnish €0.25. Cost of goods comes to €6.73.
With a target ratio of 30% — factor 3.33 — the net selling price is €22.41. Rounded to the next price point, the dish goes on the menu at €23.50 gross, provided the tax rate allows it.
Drink example: gin and tonic
5 cl of gin from a 0.7 l bottle at €21.00 net costs €1.50. A mixer at €0.55 plus ice and garnish at €0.20 are added. Cost of goods is €2.25.
With a target ratio of 18% — factor 5.6 — the net selling price is €12.60. Pouring discipline is decisive here: if 6 cl are free-poured instead of the costed 5 cl, cost of goods rises to €2.55 and the ratio to 20.2%. At 150 drinks per weekend, that is around €45 of margin nobody books.
6. Net, gross and VAT
Costing is always done net. VAT is a pass-through item and is not available to the venue to cover costs. If you take the gross price as your starting point, you overestimate your margin by the full tax rate.
In hospitality, different rates apply depending on the use case — eat-in, takeaway and drinks are not treated the same. Which rate applies when and what changed in 2026 is covered in the article on VAT in hospitality. For costing, regardless of this: purchases net, revenue net, ratio net.
7. From the costed price to a sellable price
Costing gives you a floor, not a menu price. Three adjustments lie between the two.
Price points. €22.41 is not a menu price. Round up to the next plausible price point, not down — every cent rounded down is margin given away over the entire life of the menu.
Mixed costing. Not every dish has to hit the target ratio. A classic with high cost of goods can stay on as a traffic driver if high-margin items balance it out. What matters is the ratio across the actual sales mix, not across the menu. Which items pay their way and which only take up space is clarified by menu engineering.
Contribution margin instead of percentages. A dish with 38% cost of goods and a selling price of €42 brings in €26 gross profit. A dish with 24% and €11 brings in €8.40. Here the worse ratio is the better item. The system behind this is described in the article on contribution margin costing.
8. The five most common costing mistakes
Outdated purchase prices. A costing based on prices from the spring menu change is no longer a costing in autumn. With double-digit price movements in individual product groups, the ratio shifts by percentage points without anything having happened in the venue.
Ignoring preparation and pouring losses. The calculation uses the purchased weight instead of the usable weight. The error is structural and affects every portion.
Overheads estimated as a flat rate. Staff, energy and rent are allocated by rule of thumb instead of being derived from the actual cost structure. The result looks like a costing but is an opinion.
Only food is costed. In many venues the drinks menu generates the larger share of gross profit and is still recalculated less often. You’ll find a template and the structure in the article on creating a drinks menu.
Costing without a cross-check. The costed cost of goods is a target value. What actually disappears from the storeroom is only shown by the stocktake. Without this reconciliation, every costing remains a claim.
9. Keeping costing up to date: the target-vs-actual comparison
The real value of costing comes from repetition. Three rhythms have proven themselves.
| Rhythm | Task | Trigger for recosting |
|---|---|---|
| Monthly | Determine actual cost of goods from the stocktake and incoming invoices, compare against the costed target value | Variance of more than 2 percentage points |
| Quarterly | Check purchase prices of the 20 most important ingredients — they usually make up most of purchasing costs | Price change of more than 10% on a core ingredient |
| When the menu changes | Full recosting of all items, analyse the previous period’s sales mix | Always |
The difference between target and actual is the real control figure. A venue with a costed 28% and a measured 33% loses five percentage points in places that never show up in any booking: portioning, shrinkage, breakage, staff consumption. At €800,000 net revenue, that is €40,000 a year.
10. Excel or software: what works when
For a venue with a manageable menu and stable supplier prices, a spreadsheet is enough. From the point at which prices move constantly, several sites are involved or the target-vs-actual comparison is to run regularly, manual maintenance becomes the bottleneck.
| Criterion | Excel template | Costing software |
|---|---|---|
| Getting started | Immediately, at no cost | Set-up with item master data and recipes required |
| Price maintenance | Every ingredient manually, for every supplier price | Taken over from the delivery note, recipes recalculate automatically |
| Multiple sites | Separate files, version conflicts | One item master, analysis per site |
| Target-vs-actual comparison | Manual reconciliation with stocktake and sales data | With POS integration: target from sales and recipes against actual consumption from the stocktake |
| Risk of errors | Broken formulas, outdated versions, no change log | Central version, traceable history |
If you want to start with a spreadsheet: the ready-made free Excel template for price costing already links cost of goods, selling price and contribution margin.
BarBrain picks up where the spreadsheet stops: recipe costing (available as an add-on) based on the actual item master, prices taken over from the scanned delivery note, target-vs-actual comparison against the stocktake and integration of POS data. Over 1,000 venues in the DACH region work with it; Schloss Elmau reduced its stocktake time from 6–8 hours to 2–3 hours.
11. Frequently asked questions
How do I calculate a price in hospitality?
First determine the cost of goods for a portion, including preparation and pouring losses. Then add overheads and profit to get the net selling price, and finally add VAT. For a quick day-to-day calculation, multiply cost of goods by the costing factor that results from your target ratio.
What are the three types of costing?
Forward costing from cost of goods to selling price, backward costing from the usual market price to the permissible cost of goods, and margin costing, where price and costs are fixed and the remaining margin is determined.
What markup on the purchase price is usual in hospitality?
The markup results from the target ratio and varies widely by product group. Food in casual dining typically carries a markup of between 213 and 257 per cent, which corresponds to a factor of 3.1 to 3.6. For spirits, markups of 456 to 730 per cent are usual, because the raw material share per pour is low.
How high should cost of goods be in hospitality?
For food, a range of 28 to 35 per cent of net revenue is a common guide, depending on concept and venue type. Drinks are significantly lower. The ratio only becomes meaningful when compared with your own previous month and the costed target value, not with an industry average.
Conclusion
Robust costing needs three things: complete cost of goods including losses, a deliberate profit markup instead of a residual, and a regular comparison of target and actual. If you keep these three points clean, you spot margin losses within weeks instead of in the annual accounts. The quickest way in is a single item: take the best-selling dish on your menu, run it through the scheme from section 3 and compare the result with the price it carries today.

About the author
Angela Forster
Business Development